Introduction
To understand exercise physiology, we must first explore one of its most foundational topics: energy systems. Why? Because everything you do, whether it's sitting on a couch or running a marathon, requires one thing: energy. If we don't understand where that energy comes from, every other topic becomes more confusing.
Even today, many books, podcasts and YouTube videos throw around the terms "aerobic" and "anaerobic" without understanding the nuance behind them. VO₂max workouts get called "anaerobic", and the scientific literature still uses terms like the "anaerobic threshold". That term is outdated and inaccurate: the rise in blood lactate it describes is not caused by muscle running out of oxygen (Poole et al., 2021).
The truth is that energy metabolism is simpler than people often make it out to be. But underneath it all, we need to be accurate.
Adenosine Triphosphate: The Energy Currency
For humans to function, energy is required. This is where adenosine triphosphate (ATP) comes in. ATP is the energy currency of our cells. It consists of a base (adenine) attached to a sugar (ribose), to which three phosphate groups are attached.
The question, however, is: how does this ATP molecule provide energy?
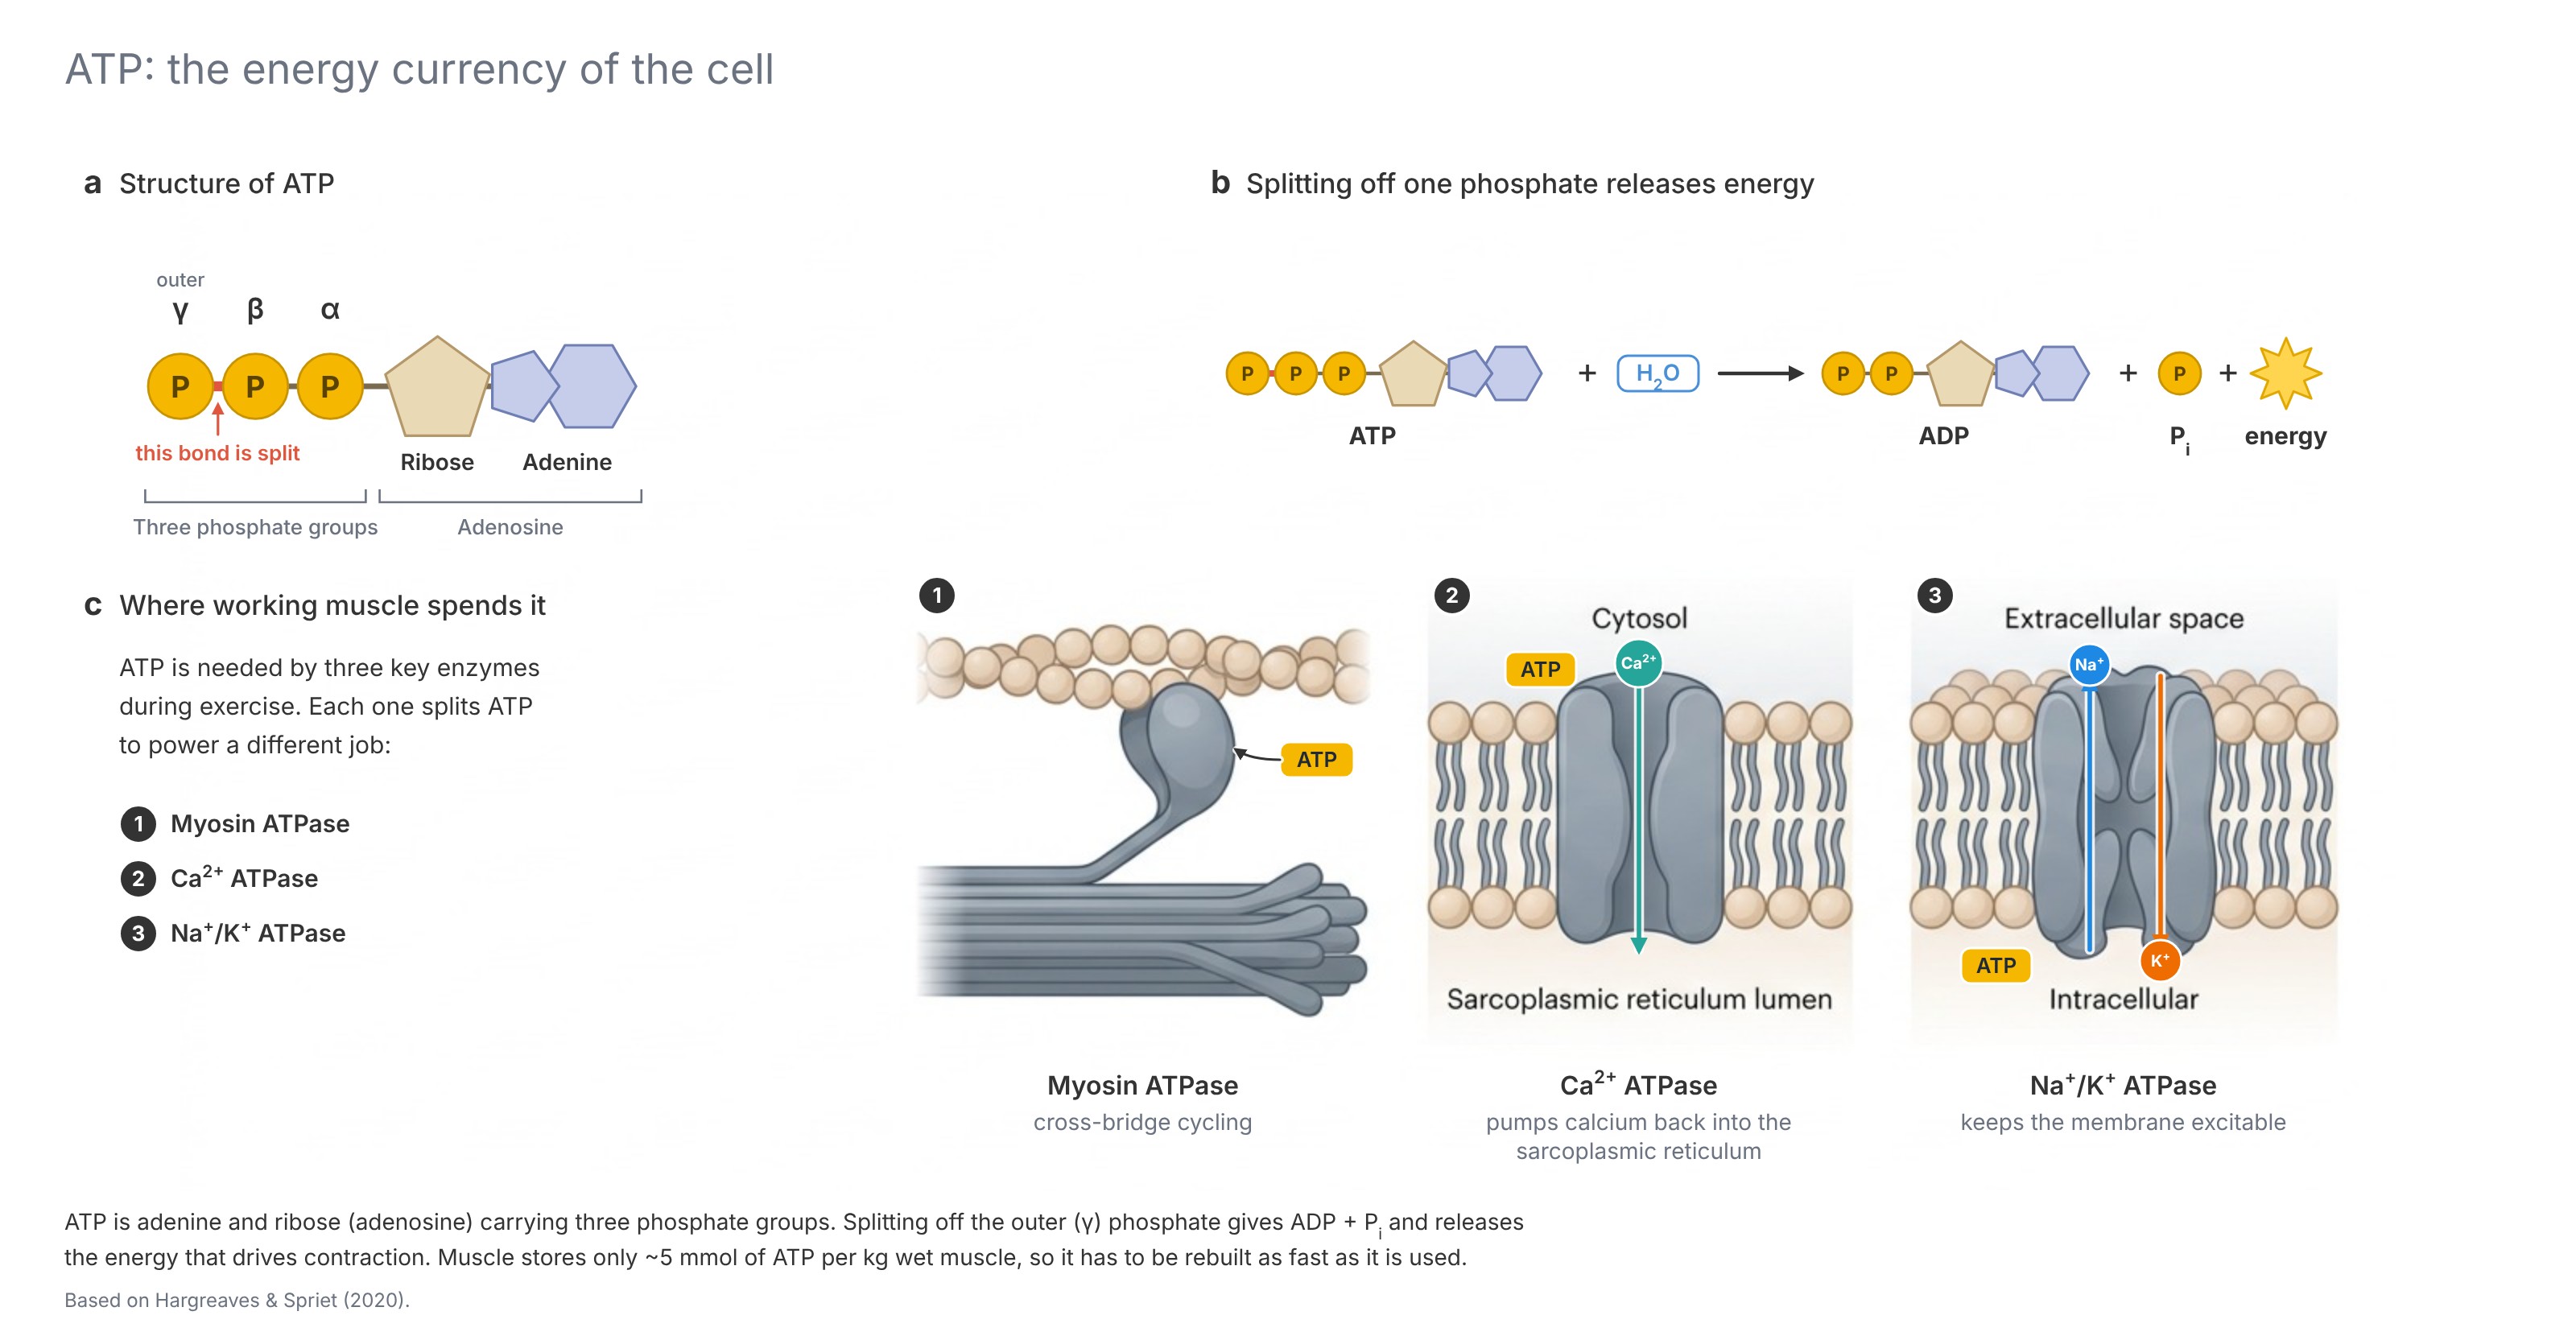
The body has five ways of supplying ATP:
- Stored ATP
- Phosphocreatine (PCr)
- Anaerobic glycolysis
- Aerobic glycolysis
- Aerobic fat oxidation
Amino acids from protein can also be oxidised, but their contribution to ATP production during exercise is low (Hargreaves & Spriet, 2020).
The main factor separating these pathways is oxygen. Humans can go weeks without food and days without water, but only a few minutes without oxygen, which shows how central it is. We can produce ATP both with and without oxygen. The pathways that don't need oxygen deliver ATP very quickly, but only for a short time. The pathways that use oxygen are slower to deliver ATP, but can keep going for hours. So the two major energy systems are:
- Anaerobic energy system: formed by adding the Greek negative prefix an- (ἀν-, "without") to aēr (ἀήρ, "air/oxygen") and bios (βίος, "life").
- Aerobic energy system: derived from the Greek words aēr (ἀήρ, "air/oxygen") and bios (βίος, "life").
One clarification matters from the start! "Anaerobic" means a pathway that does not require oxygen, not that the muscle has run out of oxygen. Anaerobic and aerobic metabolism are always active, even at rest. So it is not a matter of one or the other, but of how much each energy system contributes (Gladden, 2004; Brooks, 2018).
Combining the two major systems with the five pathways gives the following:
Now let's break down each individual pathway.
Stored ATP
ATP stores in muscle are very limited: about 25 mmol per kg of dry muscle (Gastin, 2001), or roughly 5 mmol per kg of wet muscle (Hargreaves & Spriet, 2020). During an all-out sprint, muscle breaks down ATP at about 3.7 mmol per kg per second, so stored ATP alone would last less than 2 seconds. Even at a moderate ~75% of VO₂max, it would last only about 15 seconds (Hargreaves & Spriet, 2020).
In practice, though, muscle never runs out of ATP. Even during the most intense exercise, muscle ATP falls by only around 20–40% (Gastin, 2001; Hargreaves & Spriet, 2020). That's because the other four pathways regenerate ATP as fast as it is used.
Phosphocreatine
Phosphocreatine (PCr) is the fastest way to regenerate ATP. The enzyme creatine kinase takes the phosphate group from PCr and hands it straight back to ADP:
It is a single reaction, the enzyme is abundant, and it is controlled purely by the concentrations of its substrates and products. So the moment contraction starts and ADP rises, the reaction runs and ATP is rebuilt within milliseconds (Hargreaves & Spriet, 2020). Notice that the reaction also consumes a hydrogen ion, so PCr breakdown is alkalinising: it buffers acidity rather than causing it (Robergs et al., 2004).
The limitation is capacity. Resting muscle holds about 75 mmol of PCr per kg of dry muscle, and most of it is gone after 10–15 seconds of all-out exercise (Hargreaves & Spriet, 2020). The rate of PCr breakdown is highest in the very first moments and already starts to fall after about 1.3 seconds. Over the first 6 seconds of a sprint, roughly half of the ATP comes from PCr (Gastin, 2001).
PCr is rebuilt only by aerobic metabolism, which is why its recovery depends on blood flow: when the circulation to a muscle is blocked with a cuff, PCr resynthesis stops completely (Sahlin et al., 1979). After a short sprint, PCr can be fully restored within 60–120 seconds (Hargreaves & Spriet, 2020). After exhaustive efforts with heavy glycolytic flux, recovery takes minutes rather than seconds, because the accumulated acidity has to clear first (Hargreaves & Spriet, 2020). Recovery has a fast phase, with a half-time of about 21 seconds, and a slow phase, with a half-time of about 170 seconds. Sahlin and colleagues suggested that the fast phase is limited by oxygen supply and the slow phase by the removal of hydrogen ions from the muscle (Sahlin et al., 1979).

Anaerobic Glycolysis
Glycolysis means "splitting sugar", from the Greek words glyco ("sweet" or "sugar") and lysis ("to split" or "break down").
Glycolysis breaks down glucose, or the glucose units stored as glycogen, into pyruvate in the cytoplasm of the muscle cell. When that pyruvate is converted to lactate instead of entering the mitochondria, the whole pathway runs without needing oxygen. Starting from muscle glycogen, the net reaction is:
That's 3 ATP per glucose unit from glycogen. Starting from blood glucose instead, the net yield is 2 ATP, because one ATP is spent getting glucose into the pathway (Robergs et al., 2004; Melkonian & Schury, 2023).
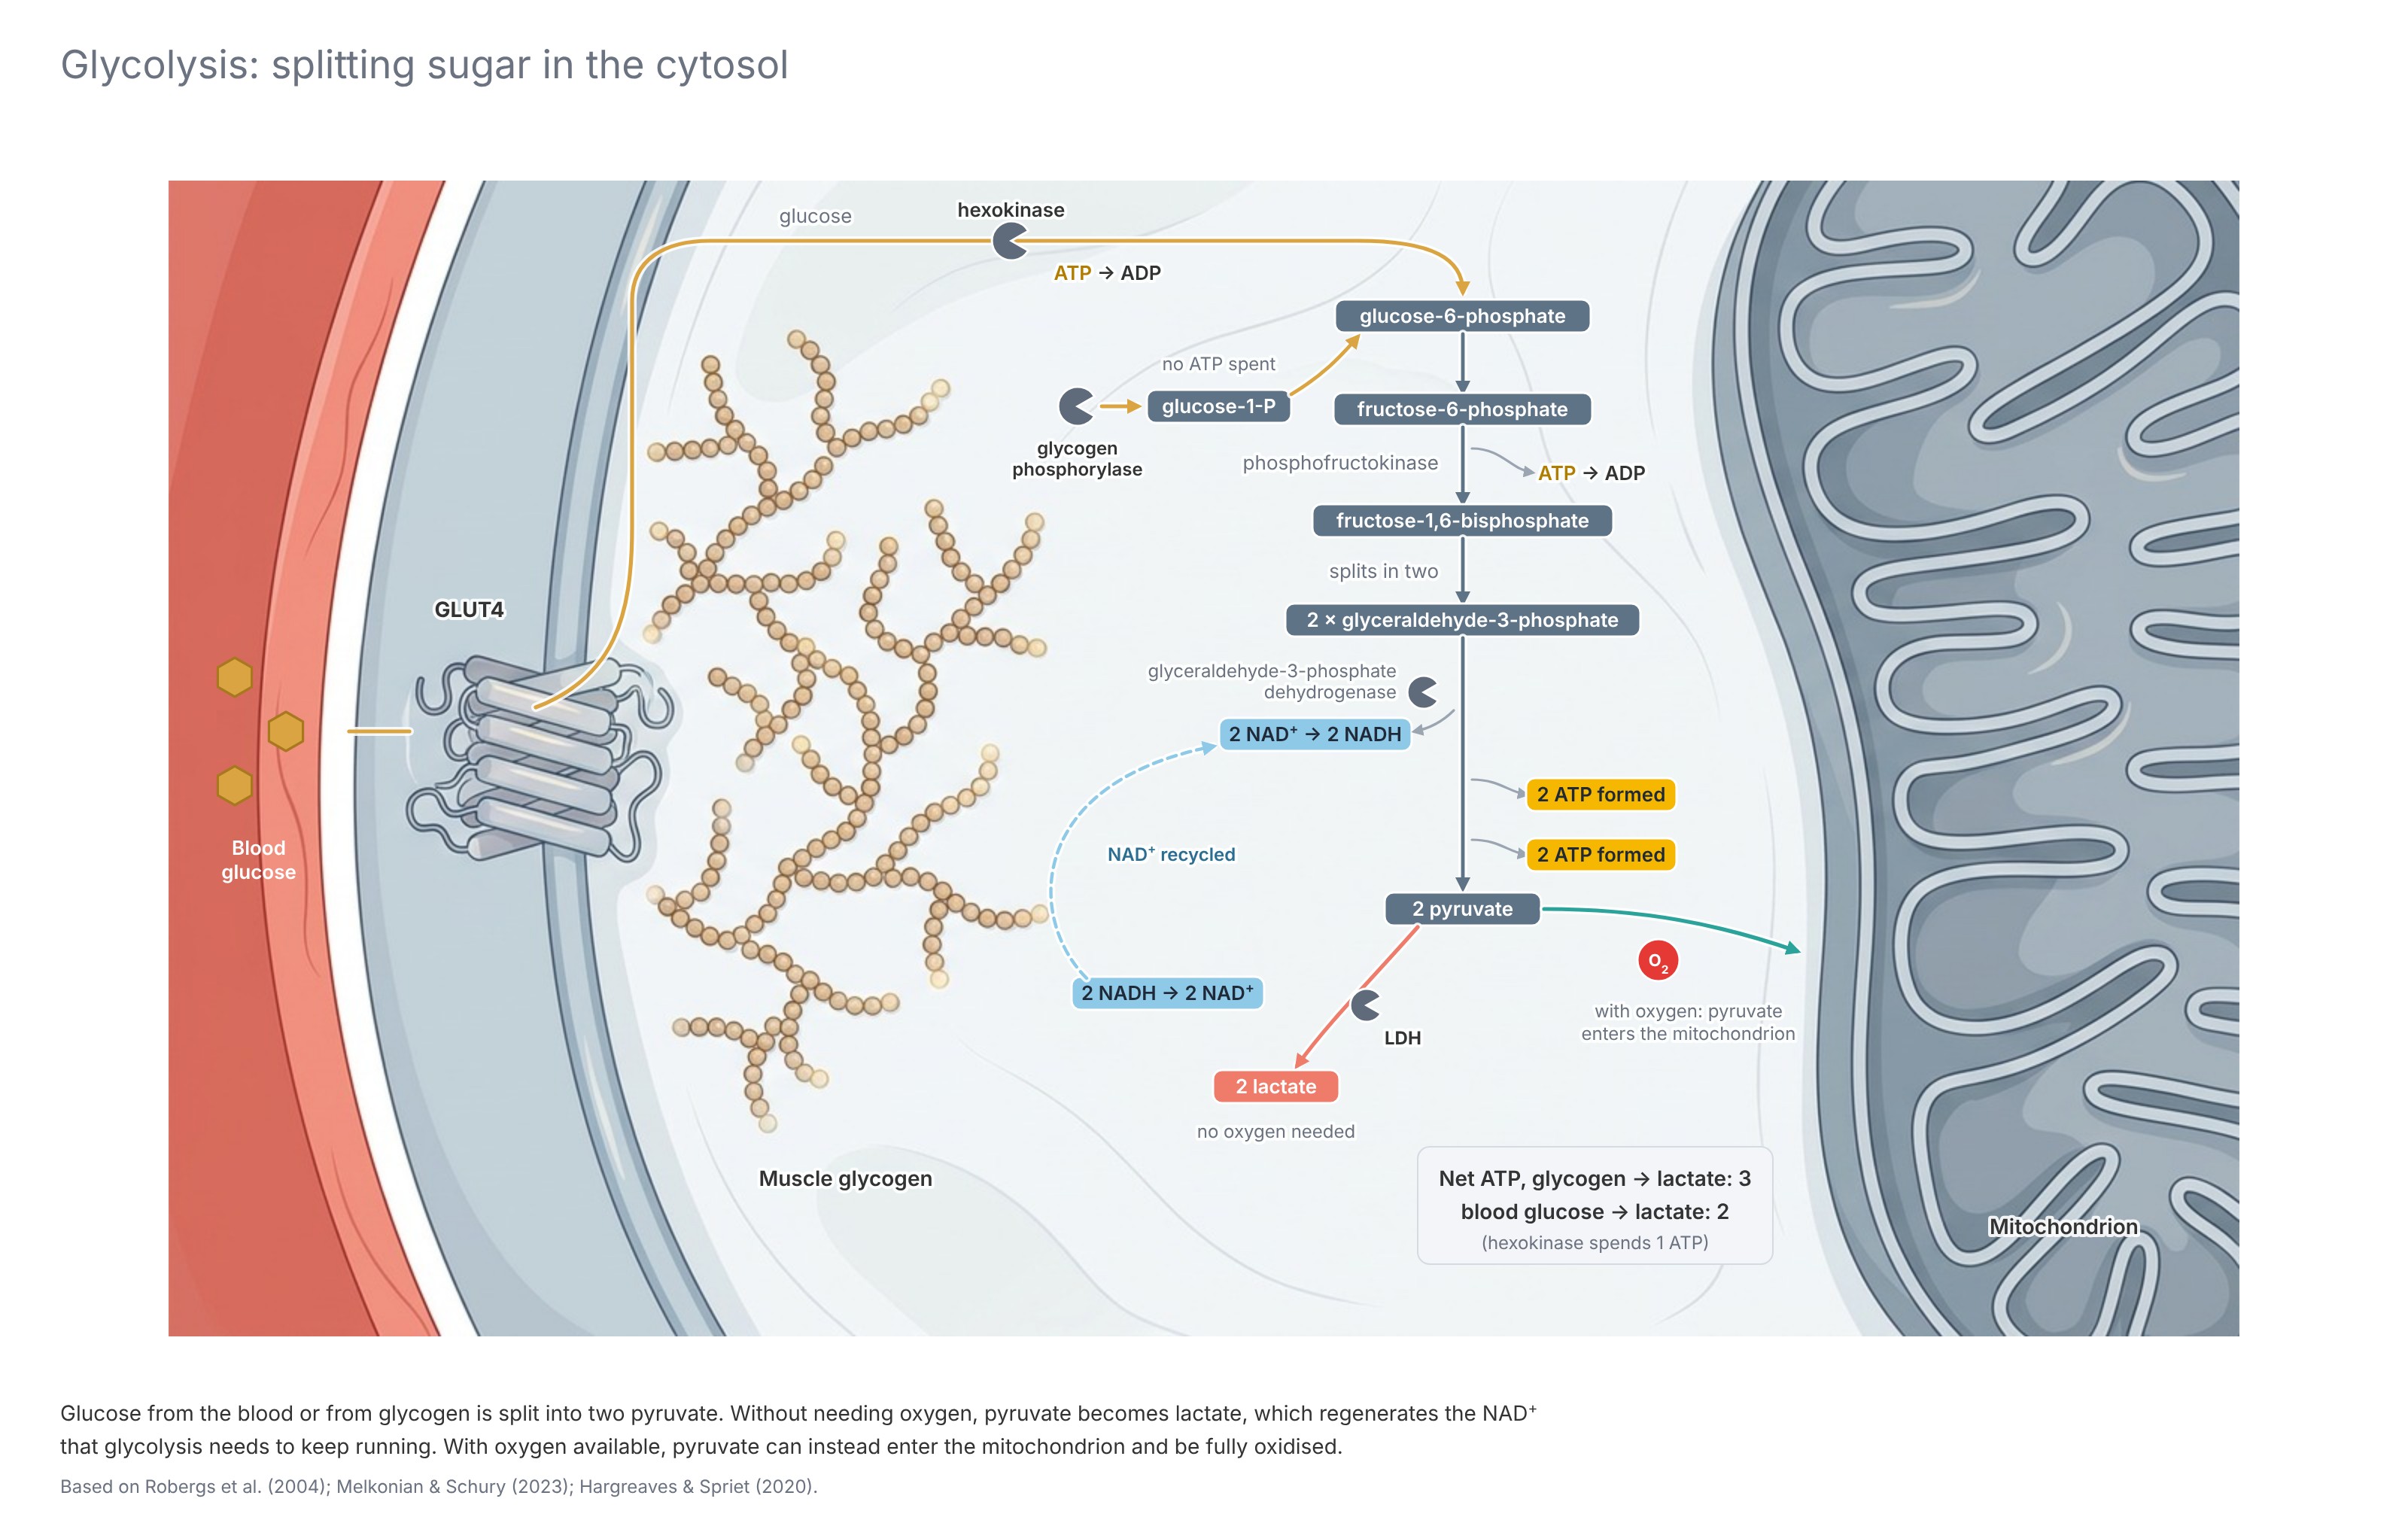
Glycolysis can be switched on within milliseconds. Lactate can be measured in muscle after a single 1-second contraction, and after 6–10 seconds of intense exercise PCr and glycolysis contribute about equally (Hargreaves & Spriet, 2020). Glycolytic ATP production reaches its maximal rate after about 5 seconds and holds it for several seconds (Gastin, 2001). This is why the classic split into an "alactic" phase followed by a "lactic" phase is misleading: both start together (Gastin, 2001).
Its capacity is limited by acidity, not fuel.
Anaerobic glycolysis can supply roughly three times as much ATP as the PCr store, about 225 mmol per kg of dry muscle in efforts lasting 30–90 seconds. What stops it is not running out of glycogen, but the rising acidity inside the muscle (Hargreaves & Spriet, 2020).
Lactate is not the villain.
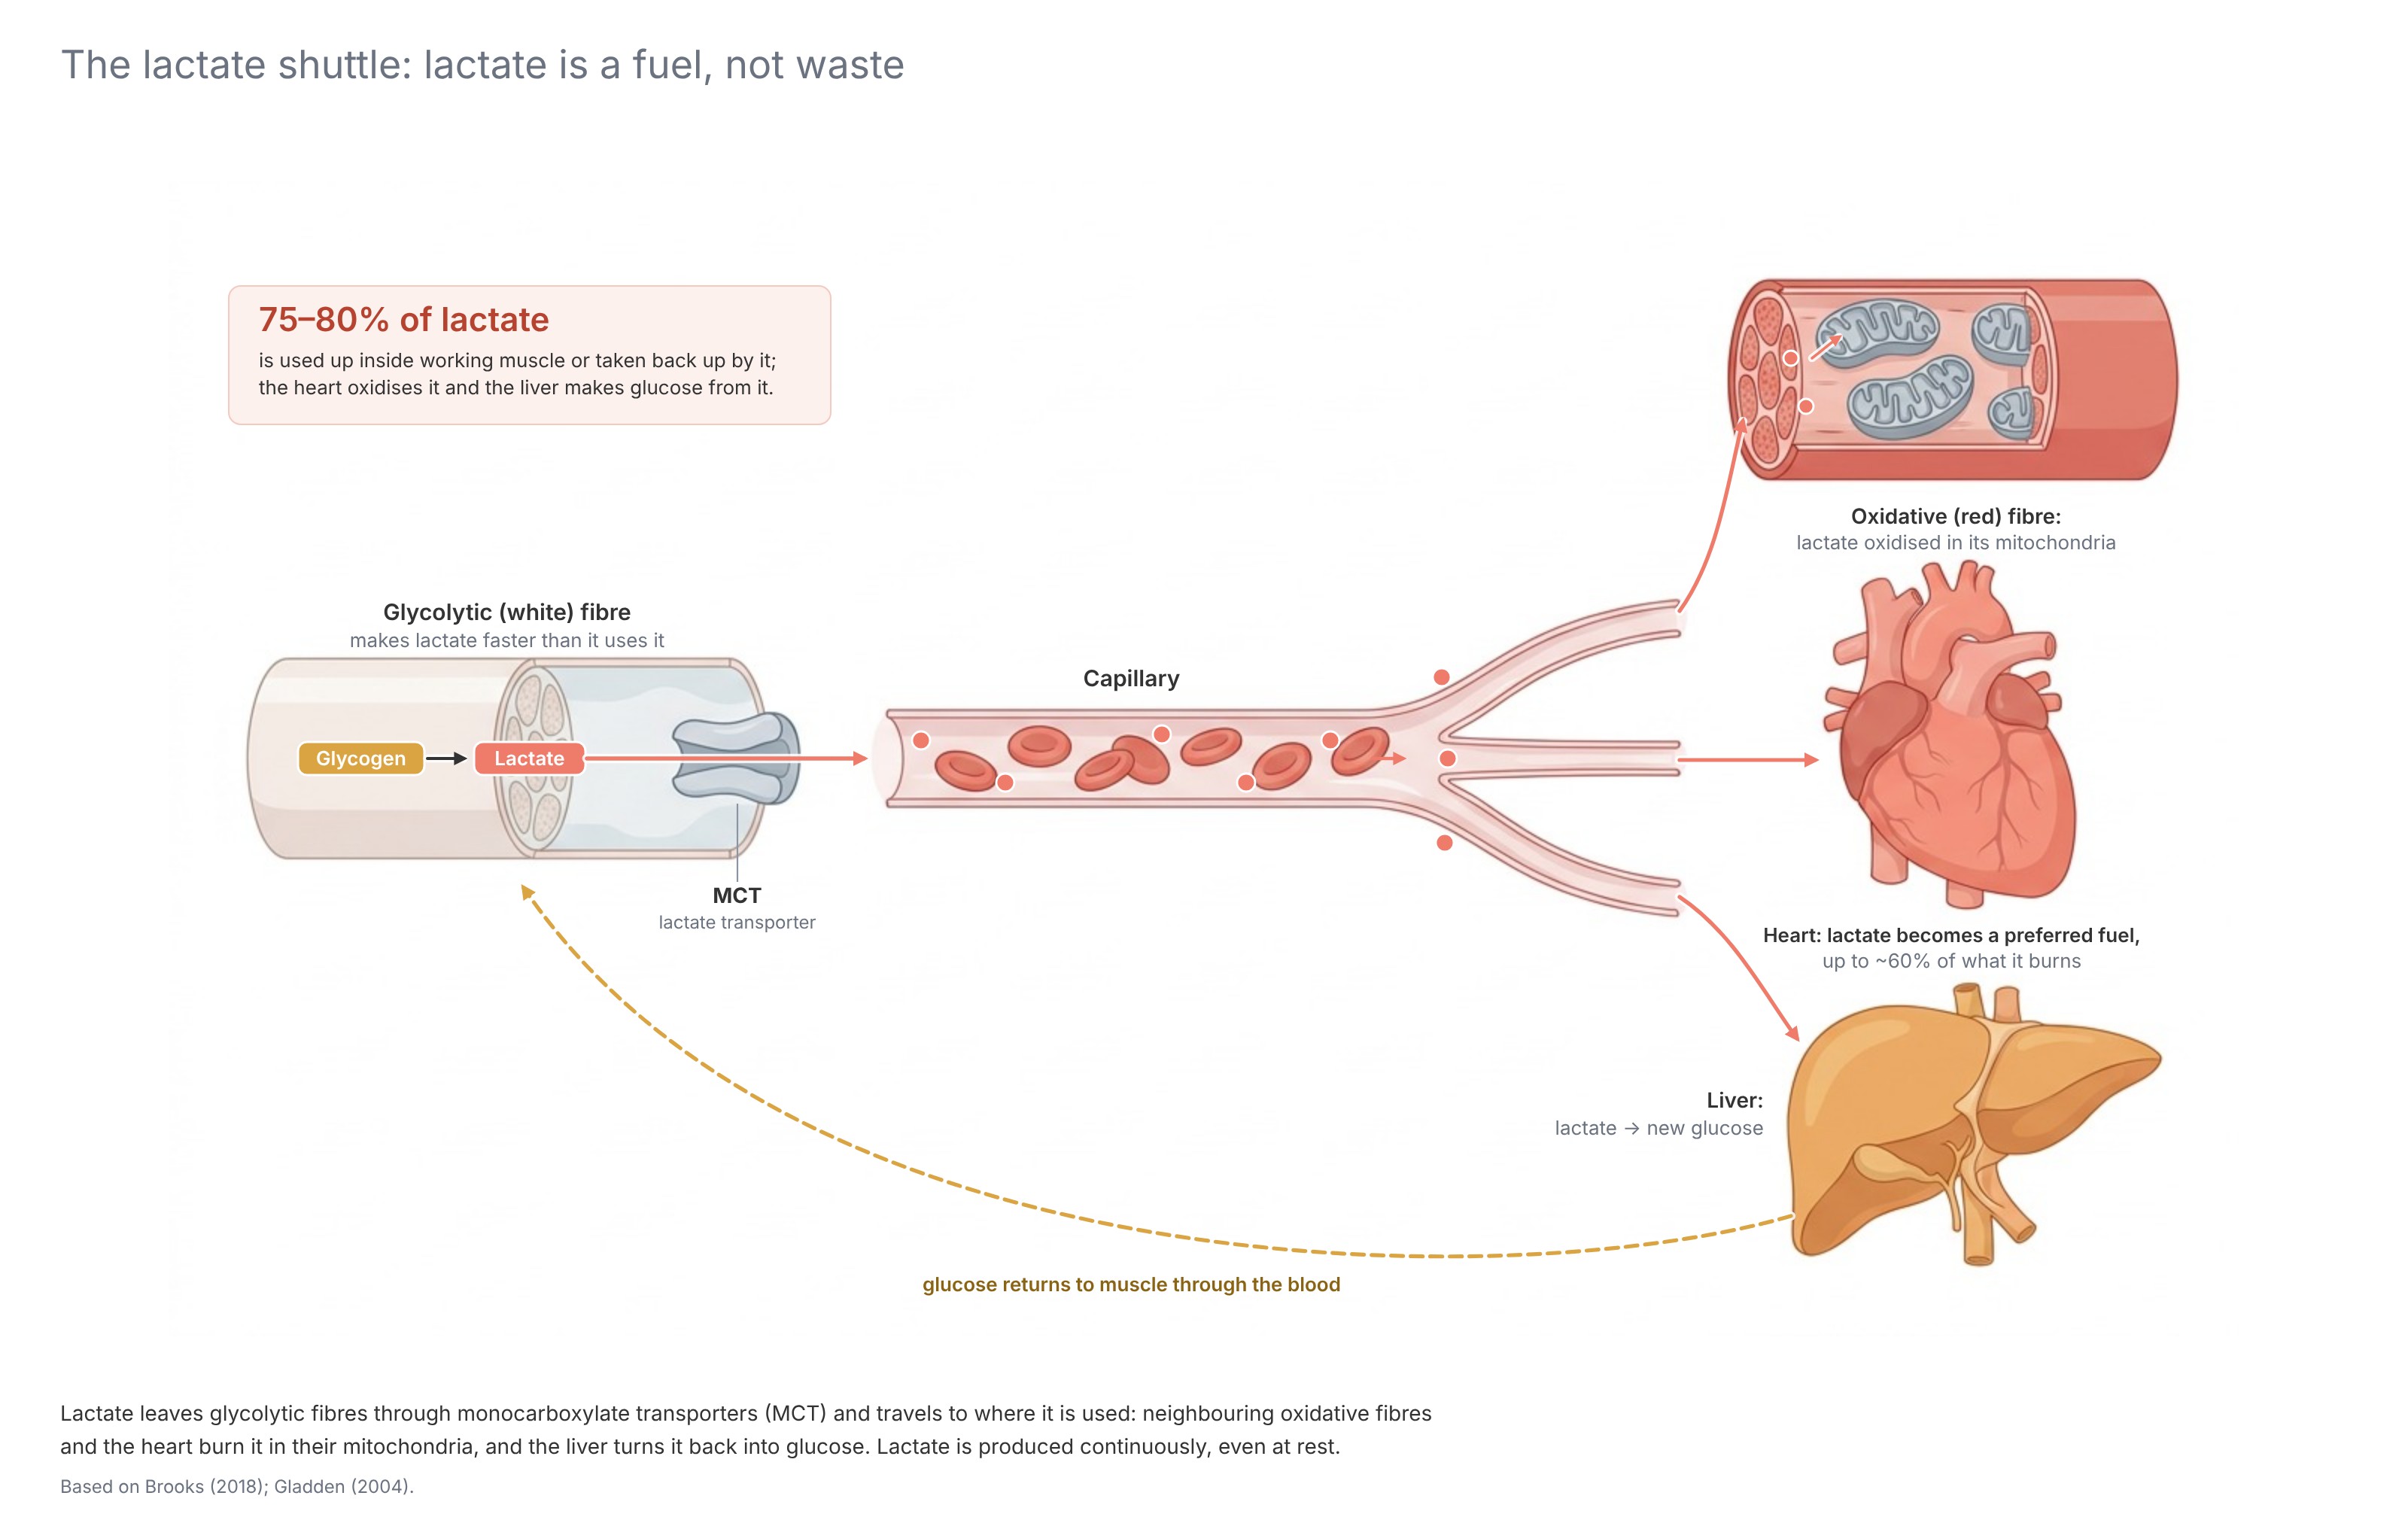
For decades lactate was treated as a waste product that causes fatigue and soreness. We now know it is produced continuously, even at rest with plenty of oxygen, and that most of it is used as fuel by other muscle fibres and the heart, or turned back into glucose and glycogen (Brooks, 1986; Gladden, 2004; Brooks, 2018). Lactate itself is not thought to have a major negative effect on force; the acidosis matters more (Hargreaves & Spriet, 2020). Robergs and colleagues have even argued that the hydrogen ions come mainly from ATP breakdown, and that lactate production slows acidosis rather than causing it (Robergs et al., 2004).
Aerobic Glycolysis
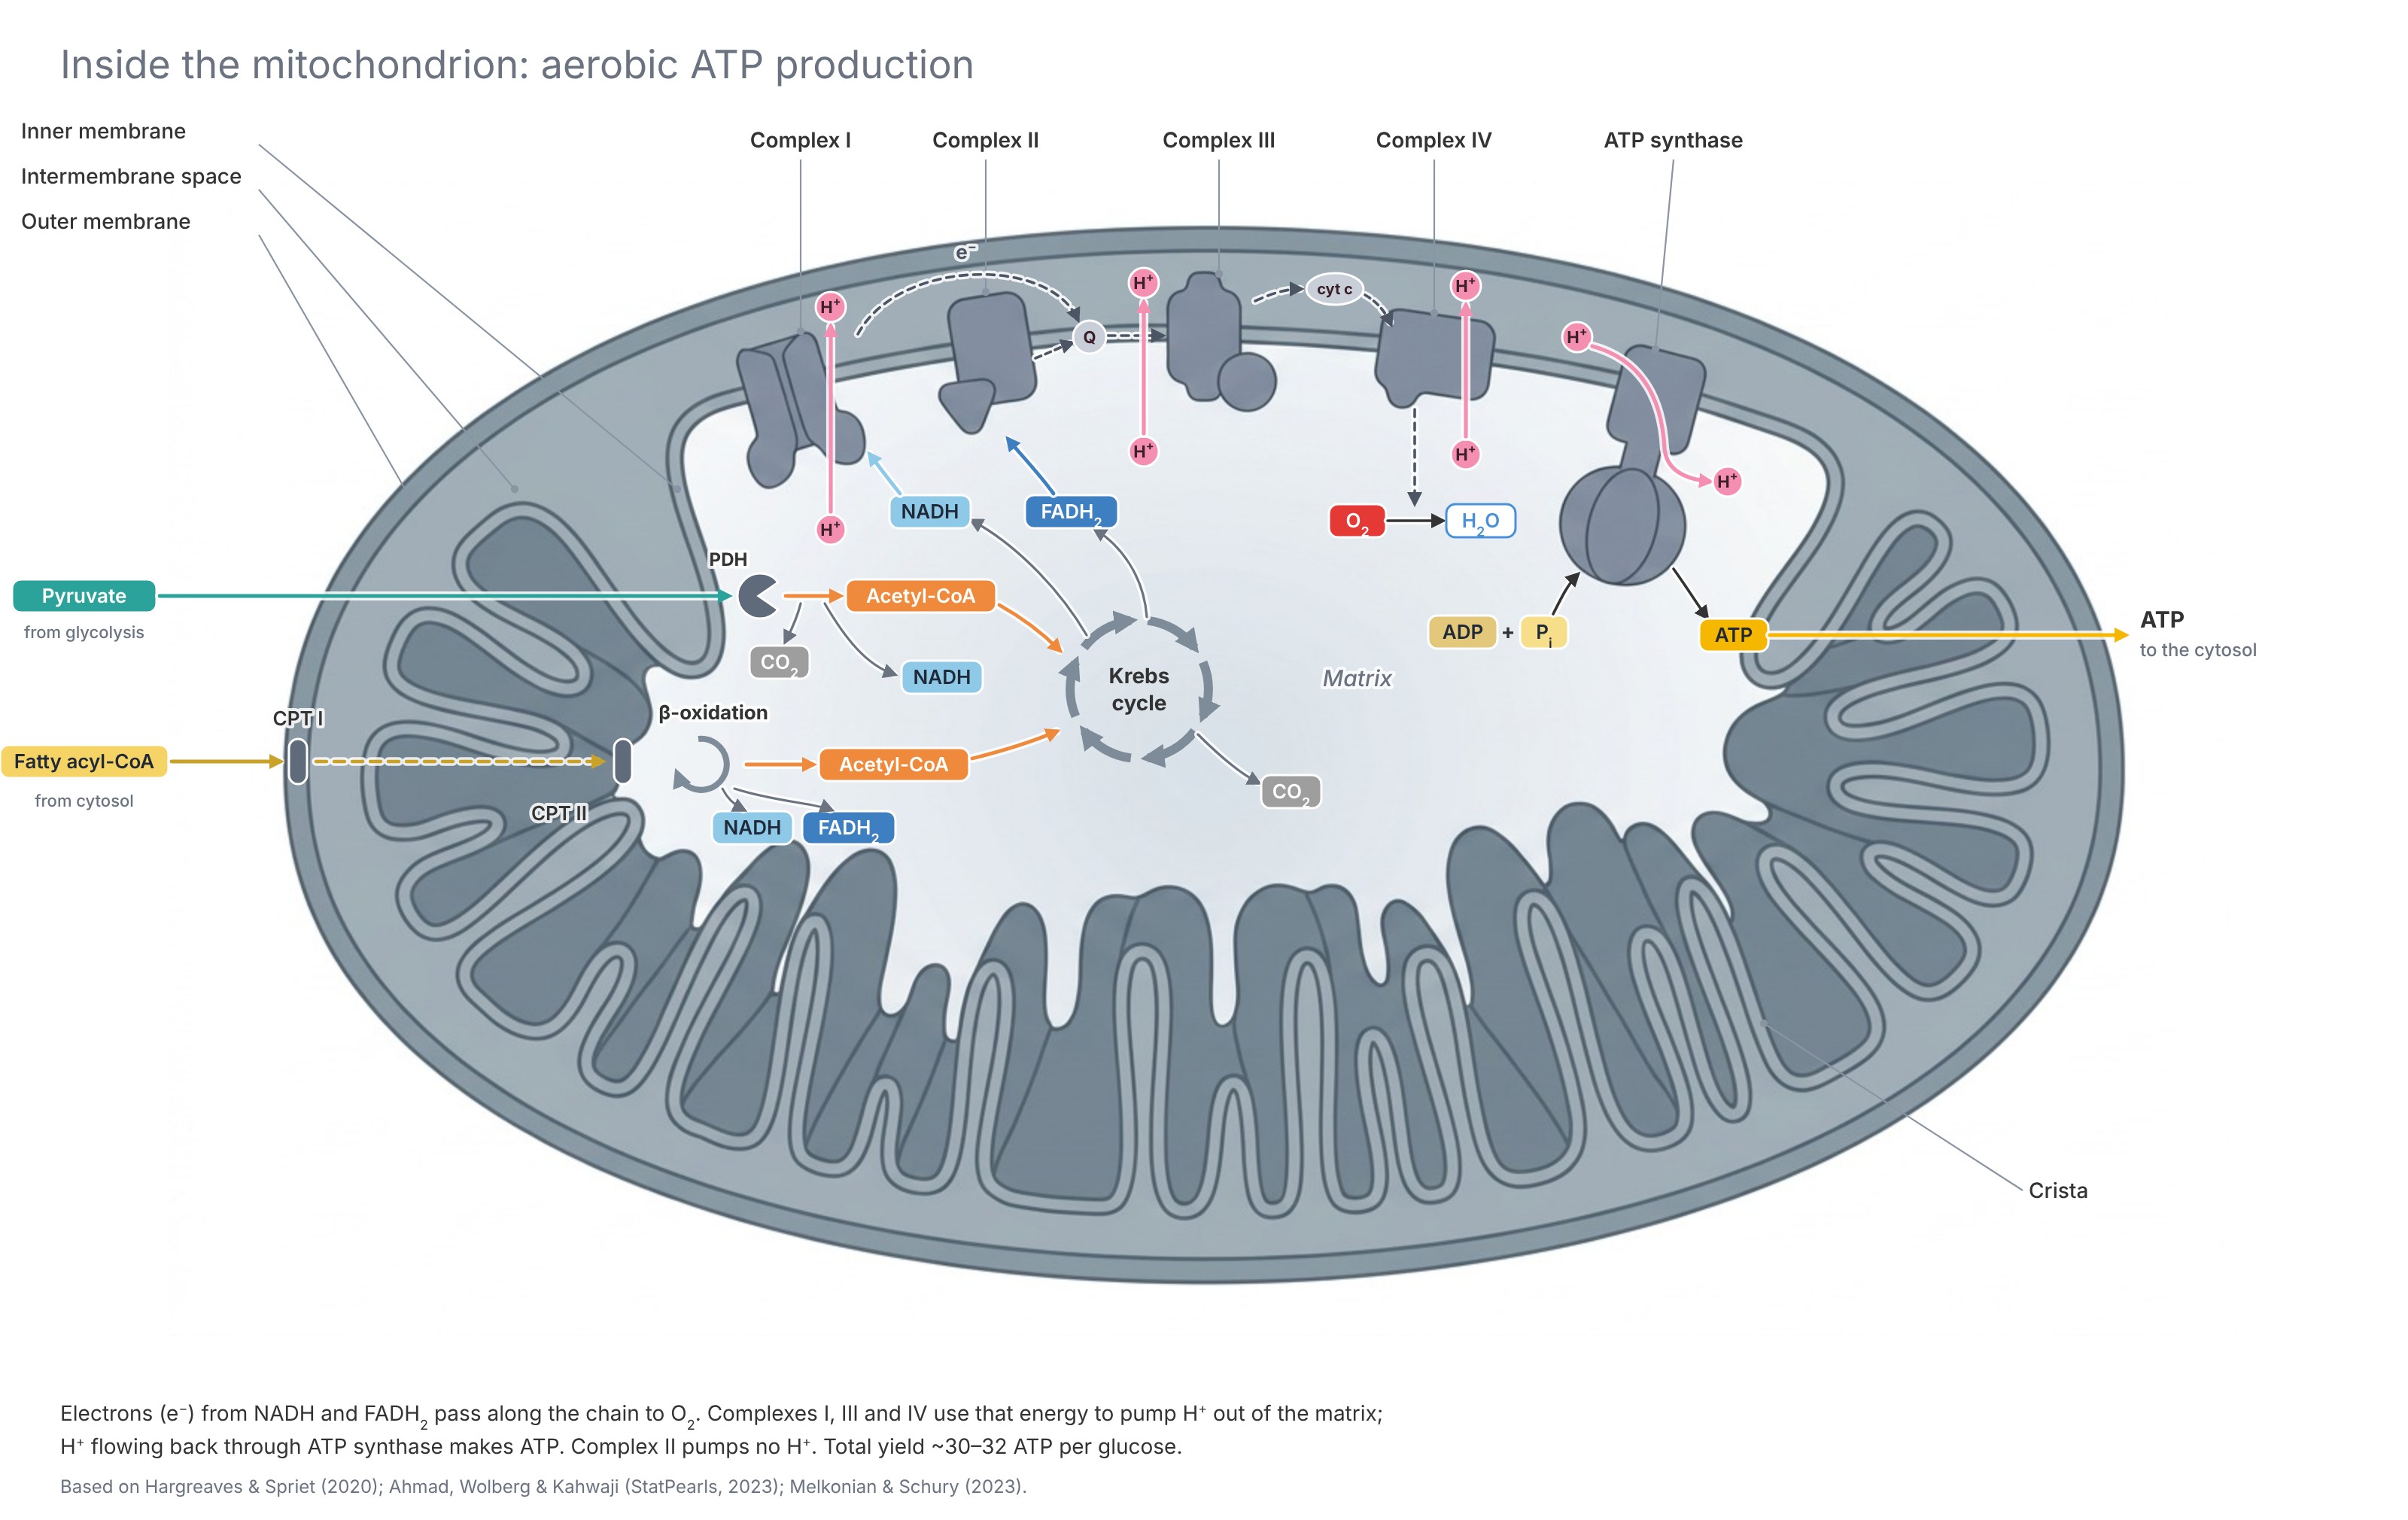
Aerobic glycolysis starts with exactly the same steps as anaerobic glycolysis. The difference is what happens to pyruvate. Instead of becoming lactate, it enters the mitochondria, where pyruvate dehydrogenase (PDH) converts it into acetyl-CoA. Acetyl-CoA feeds the tricarboxylic acid (Krebs) cycle, which strips off electrons and loads them onto NADH and FADH₂. These carriers deliver the electrons to the electron transport chain, where oxygen is the final electron acceptor and ATP is made by oxidative phosphorylation (Hargreaves & Spriet, 2020). The net result:
That's about 30–32 ATP per glucose, compared with 2–3 from anaerobic glycolysis (Melkonian & Schury, 2023).
Carbohydrates (example: glucose and glycogen) are the only fuel that can be used both aerobically and anaerobically, and it can supply all of the energy at an intensity around 100% of VO₂max. It is also about 7% more efficient than fat, meaning more ATP for each litre of oxygen consumed (Hargreaves & Spriet, 2020).
The limit is storage.
Muscle glycogen holds roughly 1,000–3,000 kcal and liver glycogen 200–400 kcal (Hargreaves & Spriet, 2020). When these stores run low in a long event, the athlete has to slow down. Bergström and colleagues showed this directly in 1967: the more glycogen in the muscle before exercise, the longer people could keep going (Bergström et al., 1967).
It is fast, but not instant.
Aerobic metabolism needs a few moments to ramp up, which is why PCr and anaerobic glycolysis cover the gap at the start of any effort. But it ramps up faster than people think. During an all-out 30-second sprint, oxygen uptake can reach 70–100% of VO₂max, and about half of the energy in the final 5 seconds comes from aerobic metabolism. In all-out efforts lasting beyond about 1 minute, such as an 800 m race, oxidative phosphorylation is already the main source of ATP (Hargreaves & Spriet, 2020).
It is highly trainable.
One of the hallmark adaptations to endurance training is a higher mitochondrial density in the muscle, and the muscle's capacity to oxidise carbohydrate rises with it (Hargreaves & Spriet, 2020).
Aerobic Fat Oxidation
Fat is by far our largest energy store. Adipose tissue holds roughly 50,000–100,000 kcal, and the muscle itself stores another 2,000–3,000 kcal as intramuscular triglyceride (Hargreaves & Spriet, 2020). Compare that with the 1,200–3,400 kcal of total glycogen above, and it's clear that we will never run out of fat during exercise.
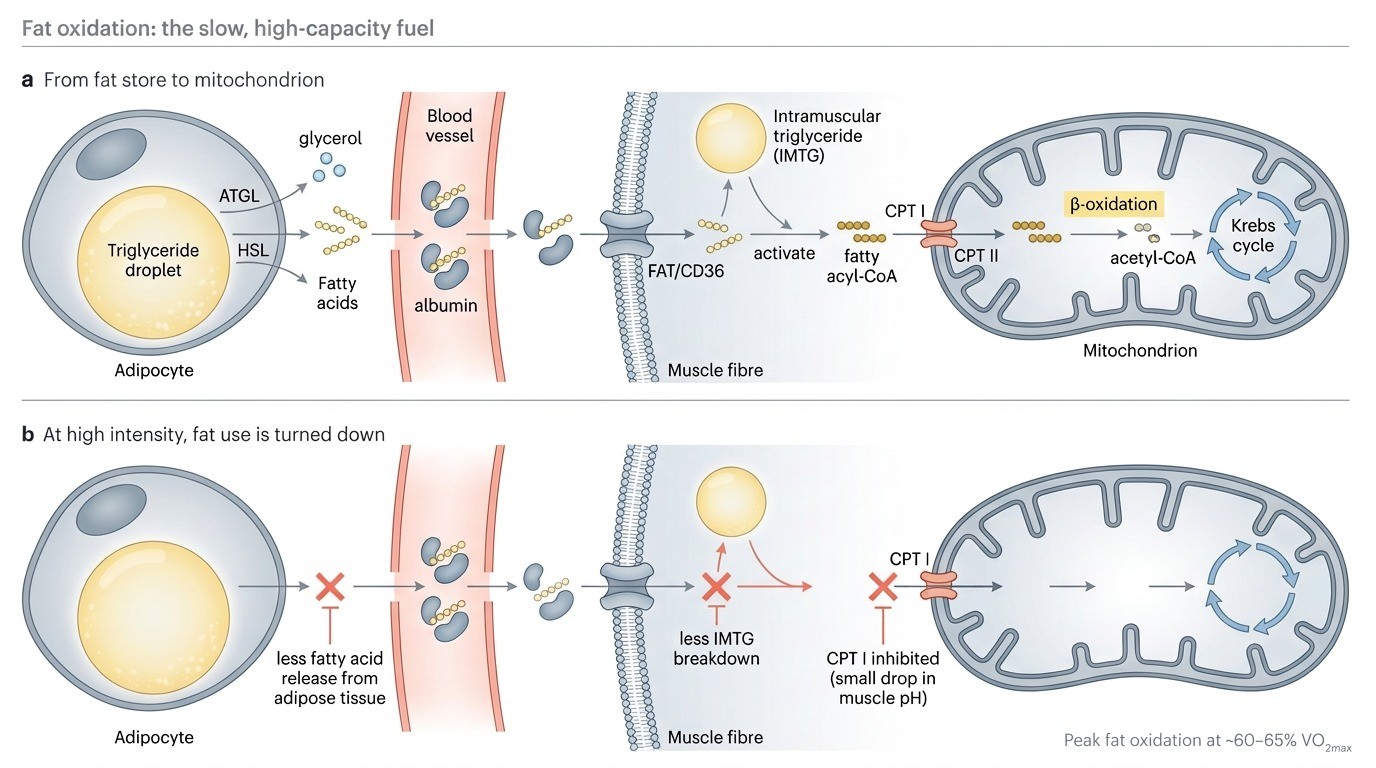
To be used, fatty acids are released from adipose tissue, carried in the blood bound to albumin, and taken up into the muscle cell. Those, together with fatty acids freed from the muscle's own triglyceride stores, are moved into the mitochondria by the carnitine palmitoyl transferase (CPT) system. There, β-oxidation chops them into acetyl-CoA, which enters the same Krebs cycle and electron transport chain as carbohydrate (Hargreaves & Spriet, 2020). For palmitate (a typical fatty acid):
That's an enormous amount of ATP per molecule, but it needs more oxygen per ATP than carbohydrate, and the chain of transport steps makes it the slowest pathway of all (Hargreaves & Spriet, 2020).
Fat oxidation peaks at moderate intensity.
Maximal rates of fat oxidation occur at about 60–65% of VO₂max (Hargreaves & Spriet, 2020). At high aerobic intensities, the body actively turns fat use down: less fat is released from adipose tissue, less intramuscular triglyceride is broken down, and the CPT system is inhibited, partly by small drops in muscle pH (Hargreaves & Spriet, 2020). Romijn and colleagues measured this in five endurance-trained cyclists at 25%, 65% and 85% of VO₂max: as intensity rose, the muscle's own stores, particularly glycogen, became the predominant fuel (Romijn et al., 1993).
Fat is the helper fuel.
At moderate intensities fat spares glycogen, so the limited carbohydrate stores last longer. Endurance training increases mitochondrial density, which lets athletes burn more fat and less carbohydrate at the same workload (Hargreaves & Spriet, 2020). That is one of the main reasons a trained athlete can hold a given pace for longer.
Putting It Together: The Systems Overlap
The most important lesson in this article is that the energy systems do not take turns. Older textbook figures showed them switching on one after another, with the aerobic system arriving late and playing little role in short efforts. Gastin (2001) pooled more than 30 studies and showed that both ideas are wrong: every pathway contributes from the very start, and the aerobic share grows much sooner than those figures suggested.
In an all-out effort of about 75 seconds, aerobic and anaerobic metabolism contribute roughly equally, as Gastin's pooled estimates in the figure above show (Gastin, 2001). For an 800 m running race, about 55–65% of the energy is aerobic (Gastin, 2001).
As an example, let's use running to visualise how the energy systems work in practice.
Lab measurements in trained (non-elite) runners give somewhat higher aerobic shares, partly because they run the distances more slowly (Gastin, 2001).
In practice, four main energy systems are relevant:
- Phosphocreatine
- Anaerobic glycolysis
- Aerobic glycolysis
- Aerobic fat oxidation
These four energy systems are the foundation not just of endurance training, but of exercise in general. In the coming articles, we will explore in depth how we rely on and use these systems to achieve peak human performance.
References
- Hargreaves, M. & Spriet, L. L. (2020). Skeletal muscle energy metabolism during exercise. Nature Metabolism, 2(9), 817–828. doi:10.1038/s42255-020-0251-4
- Poole, D. C., Rossiter, H. B., Brooks, G. A. & Gladden, L. B. (2021). The anaerobic threshold: 50+ years of controversy. Journal of Physiology, 599, 737–767. doi:10.1113/JP279963
- Gastin, P. B. (2001). Energy system interaction and relative contribution during maximal exercise. Sports Medicine, 31(10), 725–741. PubMed
- Gladden, L. B. (2004). Lactate metabolism: a new paradigm for the third millennium. Journal of Physiology, 558(1), 5–30. PMC
- Brooks, G. A. (2018). The science and translation of lactate shuttle theory. Cell Metabolism, 27(4), 757–785. doi:10.1016/j.cmet.2018.03.008
- Robergs, R. A., Ghiasvand, F. & Parker, D. (2004). Biochemistry of exercise-induced metabolic acidosis. American Journal of Physiology – Regulatory, Integrative and Comparative Physiology, 287, R502–R516. doi:10.1152/ajpregu.00114.2004
- Romijn, J. A. et al. (1993). Regulation of endogenous fat and carbohydrate metabolism in relation to exercise intensity and duration. American Journal of Physiology, 265, E380–E391. PubMed
- Bergström, J., Hermansen, L., Hultman, E. & Saltin, B. (1967). Diet, muscle glycogen and physical performance. Acta Physiologica Scandinavica, 71(2), 140–150. doi:10.1111/j.1748-1716.1967.tb03720.x
- Brooks, G. A. (1986). The lactate shuttle during exercise and recovery. Medicine and Science in Sports and Exercise, 18(3), 360–368.
- Melkonian, E. A. & Schury, M. P. (2023). Biochemistry, anaerobic glycolysis. In StatPearls. StatPearls Publishing; last updated 31 July 2023. NCBI Bookshelf NBK546695
- Sahlin, K., Harris, R. C. & Hultman, E. (1979). Resynthesis of creatine phosphate in human muscle after exercise in relation to intramuscular pH and availability of oxygen. Scandinavian Journal of Clinical and Laboratory Investigation, 39, 551–558.
- Ahmad, M., Wolberg, A. & Kahwaji, C. I. (2023). Biochemistry, electron transport chain. In StatPearls. StatPearls Publishing; last updated 4 September 2023. NCBI Bookshelf NBK526105
Introduction
To understand exercise physiology, we must first explore one of its most foundational topics: energy systems. Why? Because everything you do, whether it's sitting on a couch or running a marathon, requires one thing: energy. If we don't understand where that energy comes from, every other topic becomes more confusing.
Even today, many books, podcasts and YouTube videos throw around the terms "aerobic" and "anaerobic" without understanding the nuance behind them. VO₂max workouts get called "anaerobic", and the scientific literature still uses terms like the "anaerobic threshold". That term is outdated and inaccurate: the rise in blood lactate it describes is not caused by muscle running out of oxygen (Poole et al., 2021).
The truth is that energy metabolism is simpler than people often make it out to be. But underneath it all, we need to be accurate.
Adenosine Triphosphate: The Energy Currency
For humans to function, energy is required. This is where adenosine triphosphate (ATP) comes in. ATP is the energy currency of our cells. It consists of a base (adenine) attached to a sugar (ribose), to which three phosphate groups are attached.
The question, however, is: how does this ATP molecule provide energy?
The body has five ways of supplying ATP:
- Stored ATP
- Phosphocreatine (PCr)
- Anaerobic glycolysis
- Aerobic glycolysis
- Aerobic fat oxidation
Amino acids from protein can also be oxidised, but their contribution to ATP production during exercise is low (Hargreaves & Spriet, 2020).
The main factor separating these pathways is oxygen. Humans can go weeks without food and days without water, but only a few minutes without oxygen, which shows how central it is. We can produce ATP both with and without oxygen. The pathways that don't need oxygen deliver ATP very quickly, but only for a short time. The pathways that use oxygen are slower to deliver ATP, but can keep going for hours. So the two major energy systems are:
- Anaerobic energy system: formed by adding the Greek negative prefix an- (ἀν-, "without") to aēr (ἀήρ, "air/oxygen") and bios (βίος, "life").
- Aerobic energy system: derived from the Greek words aēr (ἀήρ, "air/oxygen") and bios (βίος, "life").
One clarification matters from the start! "Anaerobic" means a pathway that does not require oxygen, not that the muscle has run out of oxygen. Anaerobic and aerobic metabolism are always active, even at rest. So it is not a matter of one or the other, but of how much each energy system contributes (Gladden, 2004; Brooks, 2018).
Combining the two major systems with the five pathways gives the following:
Now let's break down each individual pathway.
Stored ATP
ATP stores in muscle are very limited: about 25 mmol per kg of dry muscle (Gastin, 2001), or roughly 5 mmol per kg of wet muscle (Hargreaves & Spriet, 2020). During an all-out sprint, muscle breaks down ATP at about 3.7 mmol per kg per second, so stored ATP alone would last less than 2 seconds. Even at a moderate ~75% of VO₂max, it would last only about 15 seconds (Hargreaves & Spriet, 2020).
In practice, though, muscle never runs out of ATP. Even during the most intense exercise, muscle ATP falls by only around 20–40% (Gastin, 2001; Hargreaves & Spriet, 2020). That's because the other four pathways regenerate ATP as fast as it is used.
Phosphocreatine
Phosphocreatine (PCr) is the fastest way to regenerate ATP. The enzyme creatine kinase takes the phosphate group from PCr and hands it straight back to ADP:
It is a single reaction, the enzyme is abundant, and it is controlled purely by the concentrations of its substrates and products. So the moment contraction starts and ADP rises, the reaction runs and ATP is rebuilt within milliseconds (Hargreaves & Spriet, 2020). Notice that the reaction also consumes a hydrogen ion, so PCr breakdown is alkalinising: it buffers acidity rather than causing it (Robergs et al., 2004).
The limitation is capacity. Resting muscle holds about 75 mmol of PCr per kg of dry muscle, and most of it is gone after 10–15 seconds of all-out exercise (Hargreaves & Spriet, 2020). The rate of PCr breakdown is highest in the very first moments and already starts to fall after about 1.3 seconds. Over the first 6 seconds of a sprint, roughly half of the ATP comes from PCr (Gastin, 2001).
PCr is rebuilt only by aerobic metabolism, which is why its recovery depends on blood flow: when the circulation to a muscle is blocked with a cuff, PCr resynthesis stops completely (Sahlin et al., 1979). After a short sprint, PCr can be fully restored within 60–120 seconds (Hargreaves & Spriet, 2020). After exhaustive efforts with heavy glycolytic flux, recovery takes minutes rather than seconds, because the accumulated acidity has to clear first (Hargreaves & Spriet, 2020). Recovery has a fast phase, with a half-time of about 21 seconds, and a slow phase, with a half-time of about 170 seconds. Sahlin and colleagues suggested that the fast phase is limited by oxygen supply and the slow phase by the removal of hydrogen ions from the muscle (Sahlin et al., 1979).
Anaerobic Glycolysis
Glycolysis means "splitting sugar", from the Greek words glyco ("sweet" or "sugar") and lysis ("to split" or "break down").
Glycolysis breaks down glucose, or the glucose units stored as glycogen, into pyruvate in the cytoplasm of the muscle cell. When that pyruvate is converted to lactate instead of entering the mitochondria, the whole pathway runs without needing oxygen. Starting from muscle glycogen, the net reaction is:
That's 3 ATP per glucose unit from glycogen. Starting from blood glucose instead, the net yield is 2 ATP, because one ATP is spent getting glucose into the pathway (Robergs et al., 2004; Melkonian & Schury, 2023).
Glycolysis can be switched on within milliseconds. Lactate can be measured in muscle after a single 1-second contraction, and after 6–10 seconds of intense exercise PCr and glycolysis contribute about equally (Hargreaves & Spriet, 2020). Glycolytic ATP production reaches its maximal rate after about 5 seconds and holds it for several seconds (Gastin, 2001). This is why the classic split into an "alactic" phase followed by a "lactic" phase is misleading: both start together (Gastin, 2001).
Its capacity is limited by acidity, not fuel.
Anaerobic glycolysis can supply roughly three times as much ATP as the PCr store, about 225 mmol per kg of dry muscle in efforts lasting 30–90 seconds. What stops it is not running out of glycogen, but the rising acidity inside the muscle (Hargreaves & Spriet, 2020).
Lactate is not the villain.
For decades lactate was treated as a waste product that causes fatigue and soreness. We now know it is produced continuously, even at rest with plenty of oxygen, and that most of it is used as fuel by other muscle fibres and the heart, or turned back into glucose and glycogen (Brooks, 1986; Gladden, 2004; Brooks, 2018). Lactate itself is not thought to have a major negative effect on force; the acidosis matters more (Hargreaves & Spriet, 2020). Robergs and colleagues have even argued that the hydrogen ions come mainly from ATP breakdown, and that lactate production slows acidosis rather than causing it (Robergs et al., 2004).
Aerobic Glycolysis
Aerobic glycolysis starts with exactly the same steps as anaerobic glycolysis. The difference is what happens to pyruvate. Instead of becoming lactate, it enters the mitochondria, where pyruvate dehydrogenase (PDH) converts it into acetyl-CoA. Acetyl-CoA feeds the tricarboxylic acid (Krebs) cycle, which strips off electrons and loads them onto NADH and FADH₂. These carriers deliver the electrons to the electron transport chain, where oxygen is the final electron acceptor and ATP is made by oxidative phosphorylation (Hargreaves & Spriet, 2020). The net result:
That's about 30–32 ATP per glucose, compared with 2–3 from anaerobic glycolysis (Melkonian & Schury, 2023).
Carbohydrates (example: glucose and glycogen) are the only fuel that can be used both aerobically and anaerobically, and it can supply all of the energy at an intensity around 100% of VO₂max. It is also about 7% more efficient than fat, meaning more ATP for each litre of oxygen consumed (Hargreaves & Spriet, 2020).
The limit is storage.
Muscle glycogen holds roughly 1,000–3,000 kcal and liver glycogen 200–400 kcal (Hargreaves & Spriet, 2020). When these stores run low in a long event, the athlete has to slow down. Bergström and colleagues showed this directly in 1967: the more glycogen in the muscle before exercise, the longer people could keep going (Bergström et al., 1967).
It is fast, but not instant.
Aerobic metabolism needs a few moments to ramp up, which is why PCr and anaerobic glycolysis cover the gap at the start of any effort. But it ramps up faster than people think. During an all-out 30-second sprint, oxygen uptake can reach 70–100% of VO₂max, and about half of the energy in the final 5 seconds comes from aerobic metabolism. In all-out efforts lasting beyond about 1 minute, such as an 800 m race, oxidative phosphorylation is already the main source of ATP (Hargreaves & Spriet, 2020).
It is highly trainable.
One of the hallmark adaptations to endurance training is a higher mitochondrial density in the muscle, and the muscle's capacity to oxidise carbohydrate rises with it (Hargreaves & Spriet, 2020).
Aerobic Fat Oxidation
Fat is by far our largest energy store. Adipose tissue holds roughly 50,000–100,000 kcal, and the muscle itself stores another 2,000–3,000 kcal as intramuscular triglyceride (Hargreaves & Spriet, 2020). Compare that with the 1,200–3,400 kcal of total glycogen above, and it's clear that we will never run out of fat during exercise.
To be used, fatty acids are released from adipose tissue, carried in the blood bound to albumin, and taken up into the muscle cell. Those, together with fatty acids freed from the muscle's own triglyceride stores, are moved into the mitochondria by the carnitine palmitoyl transferase (CPT) system. There, β-oxidation chops them into acetyl-CoA, which enters the same Krebs cycle and electron transport chain as carbohydrate (Hargreaves & Spriet, 2020). For palmitate (a typical fatty acid):
That's an enormous amount of ATP per molecule, but it needs more oxygen per ATP than carbohydrate, and the chain of transport steps makes it the slowest pathway of all (Hargreaves & Spriet, 2020).
Fat oxidation peaks at moderate intensity.
Maximal rates of fat oxidation occur at about 60–65% of VO₂max (Hargreaves & Spriet, 2020). At high aerobic intensities, the body actively turns fat use down: less fat is released from adipose tissue, less intramuscular triglyceride is broken down, and the CPT system is inhibited, partly by small drops in muscle pH (Hargreaves & Spriet, 2020). Romijn and colleagues measured this in five endurance-trained cyclists at 25%, 65% and 85% of VO₂max: as intensity rose, the muscle's own stores, particularly glycogen, became the predominant fuel (Romijn et al., 1993).
Fat is the helper fuel.
At moderate intensities fat spares glycogen, so the limited carbohydrate stores last longer. Endurance training increases mitochondrial density, which lets athletes burn more fat and less carbohydrate at the same workload (Hargreaves & Spriet, 2020). That is one of the main reasons a trained athlete can hold a given pace for longer.
Putting It Together: The Systems Overlap
The most important lesson in this article is that the energy systems do not take turns. Older textbook figures showed them switching on one after another, with the aerobic system arriving late and playing little role in short efforts. Gastin (2001) pooled more than 30 studies and showed that both ideas are wrong: every pathway contributes from the very start, and the aerobic share grows much sooner than those figures suggested.
In an all-out effort of about 75 seconds, aerobic and anaerobic metabolism contribute roughly equally, as Gastin's pooled estimates in the figure above show (Gastin, 2001). For an 800 m running race, about 55–65% of the energy is aerobic (Gastin, 2001).
As an example, let's use running to visualise how the energy systems work in practice.
Lab measurements in trained (non-elite) runners give somewhat higher aerobic shares, partly because they run the distances more slowly (Gastin, 2001).
In practice, four main energy systems are relevant:
- Phosphocreatine
- Anaerobic glycolysis
- Aerobic glycolysis
- Aerobic fat oxidation
These four energy systems are the foundation not just of endurance training, but of exercise in general. In the coming articles, we will explore in depth how we rely on and use these systems to achieve peak human performance.
References
- Hargreaves, M. & Spriet, L. L. (2020). Skeletal muscle energy metabolism during exercise. Nature Metabolism, 2(9), 817–828. doi:10.1038/s42255-020-0251-4
- Poole, D. C., Rossiter, H. B., Brooks, G. A. & Gladden, L. B. (2021). The anaerobic threshold: 50+ years of controversy. Journal of Physiology, 599, 737–767. doi:10.1113/JP279963
- Gastin, P. B. (2001). Energy system interaction and relative contribution during maximal exercise. Sports Medicine, 31(10), 725–741. PubMed
- Gladden, L. B. (2004). Lactate metabolism: a new paradigm for the third millennium. Journal of Physiology, 558(1), 5–30. PMC
- Brooks, G. A. (2018). The science and translation of lactate shuttle theory. Cell Metabolism, 27(4), 757–785. doi:10.1016/j.cmet.2018.03.008
- Robergs, R. A., Ghiasvand, F. & Parker, D. (2004). Biochemistry of exercise-induced metabolic acidosis. American Journal of Physiology – Regulatory, Integrative and Comparative Physiology, 287, R502–R516. doi:10.1152/ajpregu.00114.2004
- Romijn, J. A. et al. (1993). Regulation of endogenous fat and carbohydrate metabolism in relation to exercise intensity and duration. American Journal of Physiology, 265, E380–E391. PubMed
- Bergström, J., Hermansen, L., Hultman, E. & Saltin, B. (1967). Diet, muscle glycogen and physical performance. Acta Physiologica Scandinavica, 71(2), 140–150. doi:10.1111/j.1748-1716.1967.tb03720.x
- Brooks, G. A. (1986). The lactate shuttle during exercise and recovery. Medicine and Science in Sports and Exercise, 18(3), 360–368.
- Melkonian, E. A. & Schury, M. P. (2023). Biochemistry, anaerobic glycolysis. In StatPearls. StatPearls Publishing; last updated 31 July 2023. NCBI Bookshelf NBK546695
- Sahlin, K., Harris, R. C. & Hultman, E. (1979). Resynthesis of creatine phosphate in human muscle after exercise in relation to intramuscular pH and availability of oxygen. Scandinavian Journal of Clinical and Laboratory Investigation, 39, 551–558.
- Ahmad, M., Wolberg, A. & Kahwaji, C. I. (2023). Biochemistry, electron transport chain. In StatPearls. StatPearls Publishing; last updated 4 September 2023. NCBI Bookshelf NBK526105
Explore The Library
Get access to comprehensive content on performance, nutrition, and health — including current articles, training guides and practical protocols.